A browser based last.fm streamgraph using canvas.
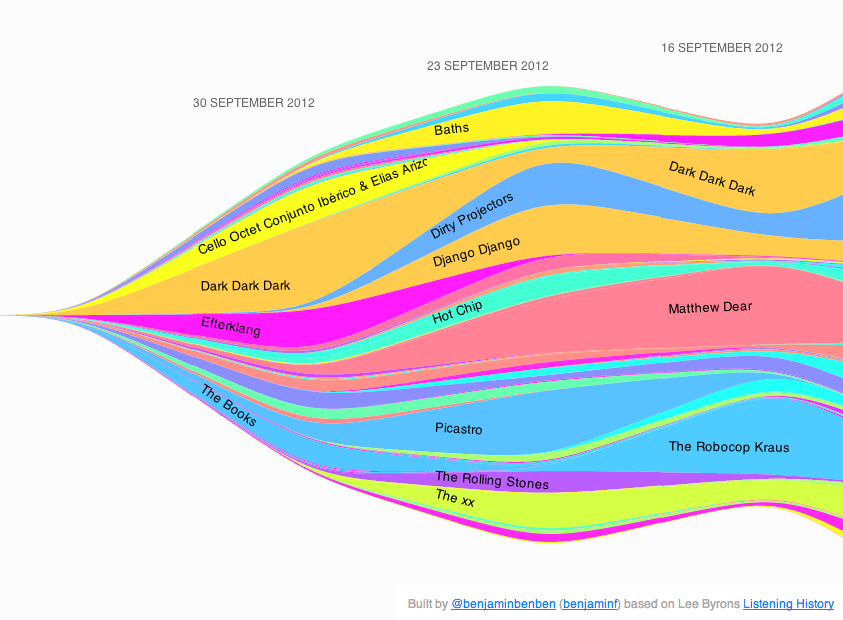
This is based on Lee Byrons listening histories project. I love this project - it's a really interesting and engaging visualisation, and the last.fm data makes it really personal (I can't think of any other services that give as much personalised data as last.fm).
There are services that let you download a pdf streamgraph: lastgraph.aeracode.org & last.fm playground (if you're a subscriber).
My version is different as all the api requesting and graph drawing are done in the browser - this lets you see your graph as soon as any data is ready.
I originally started creating a large svg for the whole chart, though this became quite slow, so I used separate canvas elements for each week of data and . This is slightly limiting - I couldn't sort or colour the artists based on when they appear in your history (as the original does).